All posts by ax8729ap

2008 PSOL Results

The results from the PSOL were waiting for me in my inbox when I returned from vacation on Sunday. I haven’t been able to do a full analysis just yet, but the preliminary look is very encouraging. I will be making several posts to this blog over the next couple of months detailing what we’ve learned from our online students from this fourth administration of the Noel-Levitz survey.

In broad strokes, of the 26 items on the standard PSOL, our students were more satisfied than the national average on 21 items, and less satisfied on only 5. Even better, the mean differences for those five items were not statistically significant from the national average. Better still, ten of the positive differences were statistically significant when compared to the national average. Here are the ten items: (click to enlarge)

PSOL results 2008

The asterisks system works as follows: 3 stars (***) indicates that the difference is significant at the .001 level. 2 stars (**) is a significance level of .01, and one star (*) is the .05 level.

We also have comparison data from the 2006 survey and the 2008 survey and I will be asking for a peer group report as soon as I get a chance. Once again the aggregate Minnesota Online data is not very pretty, but I’ll be posting some info soon about how our results compare with our consortium results.

Even though this is my first post on the 2008 results, I should probably repeat that I don’t actually put much stock in comparisons to the national group data since the demographics of that big group are not very comparable to our students. However, it is one of many comparisons that I make in order to see the whole picture.

Survey Incentives

USB flash driveWe expect to receive our 2008 PSOL results any day now. This will be our fourth year of using the same instrument to gather data about importance and satisfaction for our online offerings and services. This year we had a 23% response rate with 458 students submitting the survey out of the pool of 2,012 students who were invited to do so. All students taking at least one online course at LSC are invited to submit the survey.

The last time we used the survey was in Spring 2006. We only had a 17% submission rate (325 out of 1,889). In an effort to significantly improve the submission rate, this year we offered 40 (2 GB) flash drives by random drawing to those who submitted the survey. There were no incentives on 2006.

For about $440 ($11 per USB drive) we were able to gather data from a more significant group of our online students. I’m thinking that was well worth it. Now we need to find out what they had to say to us.

Fourth PSOL Dataset Coming Soon

Once again, Minnesota Online will be sponsoring the use of the PSOL for all interested schools in the Minnesota State Colleges and Universities. LSC will be participating again this year after taking last year off. The survey will be available to students in February and we will likely have the results in the latter part of March.

This will be our fourth time gathering data with this instrument. The previous three years have provided us with a good baseline on which to judge future changes in importance and satisfaction to the online students. We have five optional questions where we can ask any additional items that we see fit. We are planning on trying to match most or all of those five questions with similar questions on the N-L Student Satisfaction Inventory (SSI). The SSI is a similar survey that will be given this spring to our on-campus students. This will give us even additional data with which to compare the satisfaction of our online students with our on-ground students.

Short Term Controllability

Washington MonumentIt’s one thing to get the data about importance to students and their related levels of satisfaction, it’s quite another to be able to do anything about those things. On the one hand you might have an opportunity to manage student expectations which could possibly affect either importance or satisfaction, or both. On the other hand, you might be able to improve services and affect satisfaction scores in a positive way.

On the third hand, there might not be much that you can do at all, at least not without a long time horizon, lots of patience, and maybe lots of money. As I look at our results of the PSOL, I believe that there are four items where we don’t have much of an opportunity to affect results. They are as follows:

01. This institution has a good reputation.
06. Tuition paid is a worthwhile investment.
08. Student-to-student collaborations are valuable to me.
09. Adequate financial aid is available.

College reputations are not built or destroyed overnight. It may be nice to know what your students think about your reputation, but there might not be too much that you can do about it. I suppose you could start an internal promotional campaign designed to convince your current students that you really are much better than they think, but that seems silly, self-serving, and somewhat pathetic.

Convincing students that their tuition dollars are being well spent is also a rather futile exercise in my opinion. Even though that may be true, many people think that there is always a better deal right around the corner. The grass is always greener somewhere else which means that tuition is always cheaper elsewhere or the quality is better or both. Good luck trying to convince students (or any consumers) that they have misjudged the value in what they’re paying for.

Student-to-student collaboration? I’ve already posted about that a couple of times. It’s a bit of a strange question for students to assess, especially on the satisfaction scale. My satisfaction with collaborations is more a function of who the collaborators are rather than something that the institution can control.

Finally, adequate financial aid? Are you kidding me? The only adequate financial aid for many people is something that covers all their expenses (that includes beer money) and doesn’t have to be paid back. Short of that they will rate financial aid adequacy as extremely important and satisfaction level as quite low. Again, this begs the question of what the institution can possibly do about the huge gap between the importance and satisfaction scores here. Start giving away money in the hallways? I doubt it.

All told, only four out of 26 survey items that you have very little control over isn’t too bad. The other items I believe that you either have a great deal or a moderate amount of control over, or ability to influence in the short term of 1-3 year. Those are the items where you may be able to see some increases in your survey results if you pick your strategies wisely.

(What does the Washington Monument have to do with this post? Nuthin’. I just like it and it’s mine, so why not?)

Meeting Expectations

One of the important things to do with your PSOL data is to look at the gaps – the differences between the iMind the Gapmportance ratings and the satisfaction ratings expressed by the students. You’re always concerned about the larger gaps which indicate where you have significant room for improvement, if it is an item where you have much control over (or impact upon) the level of student satisfaction.

At the same time, I like to look at the smaller gaps. You also need to have some positive reinforcement for those things that are going very well – for those things where you are essentially meeting the student expectations. The seven items listed below come from the 26 standard items on the PSOL and indicate the lowest performance gaps for Lake Superior College in the FY06 satisfaction survey. The item number is shown first, followed by the full text of the item, and then the size of the gap (importance score minus satisfaction score).

08. Student-to-student collaborations are valuable to me = (.42)
This one is always interesting (see previous post about this item) because the students are basically telling you something like this: “I really don’t care much about this, but you’re doing a pretty good job with it!” This item has a decent (not great) satisfaction rating, but it has an extremely low importance score.

01. This institution has a good reputation = .02
This item is interesting to me because it tells me that we are serving the proper audience. Our students know who we are and what we can do for them. For the national numbers, the importance score is much higher than ours, which is why the national gap was .39 while ours was only .02. The satisfaction scores were almost identical, but reputation is more important to more of the students in the national survey. Keep in mind that many of those students are graduate students and have a very different demographic than our students.

18. Registration for online courses is convenient = .14
We have a low gap here because our registration system is completely online and has been for several years. It is managed by the state system (MnSCU) and seems to meet students’ needs quite effectively. This is always one of the most important survey items for students, but one with consistently high satisfaction scores.

21. Adequate online library resources are provided = .33
For several years now we have had significant online library resources available to all students. Our biggest issue is in getting them to use the resources, not whether the resources are online or not.

24. Tutoring services are readily available for online courses = .33
We are currently in our fifth year of offering online tutoring services through SMARTHINKING. We have always scored highly in this category, but you also have to keep in mind that only 10-15% of the students use tutoring services (either online or on-ground) and so the importance score is one of the lowest on the survey.

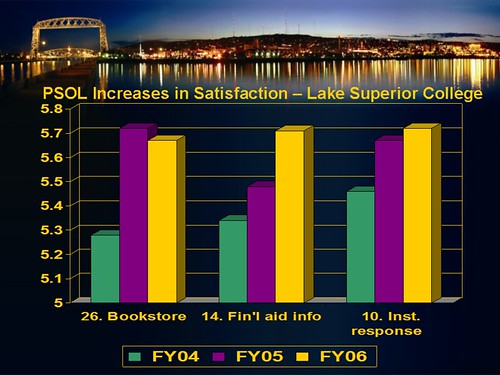
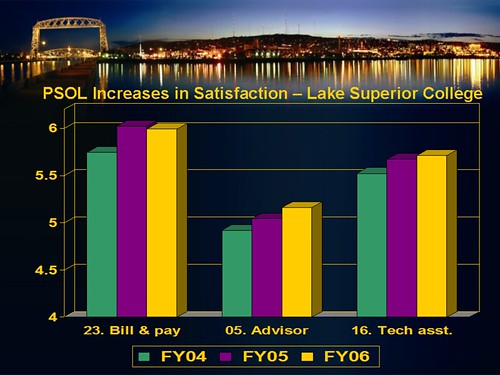
23. Billing and payment procedures are convenient for me. = .35
Much like our online registration, the billing and payment function is managed centrally for all 32 institutions. This is an item with a high importance score, but also a high satisfaction score.

19. Online career services are available = .35
This last one also is not very important to many of our online students, since so many of our online students are transfer students working on an A.A. degree of the Minnesota Transfer Curriculum. Our gap is low because this is not a hot topic for most of our students.

For me, the takeaways here are as follows:

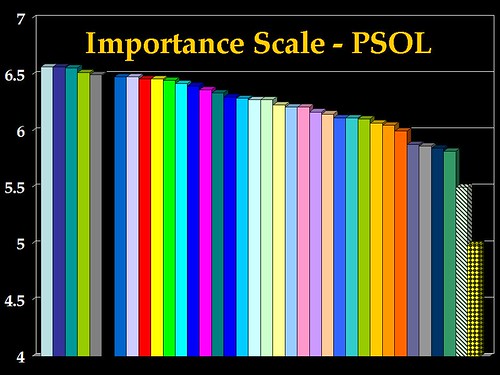
  1. Small performance gaps are often the result on items where the student ratings indicate a low importance score. That is the case for items 1, 8, 19, and 24 above. All four of those items have an importance score below 6.0 which generally indicates that most students rate them somewhere between “slightly important” and “important.”
  2. Small performance gaps on the other three items (18, 21, and 23) indicate areas where you are really meeting the needs of the students. These items have high importance scores (above 6.0) and high satisfaction scores. These are things to be proud of.
  3. Gap analysis is not an exact science. It is only a starting point in looking for places where you may be able to improve the services that are being offered to students.

(CC Flickr photo by Annie Mole)

Increases in Student Satisfaction

Since we used the PSOL for three years in a row, we are able to study trends and changing attitudes. Of course we’re also looking for evidence of satisfaction increases that might come from improvements in services that we have tried to implement. This post is intended to simply look at the overall changes in the 26 basic items in the PSOL. Looking at the directions and magnitudes of the changes in the items we see this overall picture:

  • 5 items showed decreased satisfaction (nothing greater than a .07 decrease)
  • 1 item showed no change
  • 5 items showed increased satisfaction of less than .10 rating points
  • 15 items showed increased satisfaction of .10 or greater (12 were .14 or greater)

I selected a .10 increase in rating points as significant, although a case can be made that it takes a bit more than that (maybe .14 or .15) to show a truly significant increase in the level of satisfaction.

The two charts below show those items that had the greatest increases in student satisfaction from 2004 to 2006.

chart 1 - PSOL satisfaction increases

The full survey text of the items above:

26. The bookstore provides timely service to students. (.39 increase)
14. I receive timely information on the availability of financial aid. (.37 increase)
10. This institution responds quickly when I request information. (.26 increase)

The next three highest increases are shown below.

chart 2 - PSOL satisfaction increases

The full survey text of the three items above:

23. Billing and payment procedures are convenient for me.
05. My program advisor helps me work toward career goals.
16. Appropriate technical assistance is readily available.

Sense of Community

2006 PSOL IMPORTANCE RESULTS

I’ve been asked to supply some data backing up my claim that students place a low level of importance on the idea of developing a sense of community in their e-learning opportunities. I have spoken about this at various times, including three days ago during a keynote presentation about the myths and realities of e-Learning (titled “e-Learning Mythbusters”). Above is a slide from that presentation. Showing 36 items on a slide is generally not a good approach, but this was intended to illustrate how the last two items on the far-right are significantly less important to students than the other 34 items.

There is only one question on the PSOL that seems to get at the issue of building community (sort of). Question #8 reads as follows: “Student-to-student collaborations are valuable to me.” This question probably involves more things than just building community, since student-to-student collaborations means very different things in different courses or programs. However, the fact remains that this question scores incredibly poorly on the importance scale. There are 26 importance/satisfaction questions on the PSOL (36 if you add 10 of your own, more on that below). Of the 26 questions, this one scores at #26 on the importance scale, and it’s not even close to number 25. This statement is shown in the last column (yellow-black checkered) of the 36 columns in the slide (that is LSC data with 10 added statements for a total of 36).

  • For the national results, question #8 has an importance score of 5.16. (Note: 5.0 is somewhat important)
  • For the LSC peer group institutions, #8 has an importance score of 5.17.
  • For Lake Superior College, #8 has an importance score of 5.00.
  • For Minnesota Online schools, #8 has an importance score of 4.93.

Since that question doesn’t directly measure the idea of “community,” we have added a question to our survey in two of the three annual administrations at LSC. We added the following statement: “I feel of sense of community or belonging through the LSC Virtual Campus.” With the 10 added statements, there are now 36 statements in total. This added item comes out as #35, with the student-to-student collaborations coming in at #36 and the lowest level of importance. The “sense of community” statement is shown in the chart as next-to-last column (black-white striped).

  • In year 1 (FY04) at LSC, we didn’t include this statement on the survey. (no added questions)
  • In year 2 (FY05) at LSC, this item scored 5.16 on the importance scale (35 out of 36)
  • In year 3 (FY06) at LSC, this item scored 5.50 on the importance scale (35 out of 36)

Interpreting the results is always a bit of a crapshoot at best, but here’s my take on why this is rated lowly by the students. Think of your typical online student. At my school, our online students are typically raising a family, working at one or two jobs, and in many other ways not your typical “captured” college student. In other words, they are already heavily involved in several “communities” that are very important to them – work(1), work(2), kid’s school, church, neighborhood, friends, etc. etc. For many people, the idea of developing another community (takes time and commitment) is just a bit too much to ask. One reason that they are drawn to e-Learning in the first place is because their lives are very full and heavily scheduled. They want to get their coursework done and meet deadlines (okay, that’s not always true). Building community in their e-learning takes time that they prefer to spend in other pursuits.

One more take on all this, which I believe is especially true of the younger e-learners out there. They spend a great deal of time building online community in their social networking (Facebook, MySpace, etc.). The last thing they want is for their e-Learning to look like their social networking. They are sending a message to us when they tell educators to stay out of their social networking spaces. We also need to recognize the amount of informal learning that takes place outside of the e-Learning environment. Of course, we haven’t figured out how to do that yet.

Student Expectations

Question 55 on the PSOL is one of three “Summary” questions that are placed near the end of the survey. Question 55 is a difficult question to make sense out of. It reads as follows: “So far, how has your college experience met your expectations?”

An earlier version of the survey appears to have included a slightly different question: “So far, how has the online experience met your expectations?” I actually prefer this older version of the question. Since we have students take this survey even if they are primarily on-ground students, their “college experience” can be quite different from their “online experience.”

Here are the possible responses to this question:

  1. Much worse than I expected
  2. Quite a bit worse than I expected
  3. Worse than I expected
  4. About what I expected
  5. Better than I expected
  6. Quite a bit better than I expected
  7. Much better than I expected

On the satisfaction and importance scales, a score of “4” equals a neutral rating. Here a score of 4 equals “about what I expected.” Those are not the same things, or at least we have no way of knowing whether they might be about the same or wildly different.

The problem with this measure is that we have no idea what the student expectations WERE coming into the online learning experience. Meeting their expectations might be a great thing if they had high expectation, but clearly it could be a bad thing if they very low expectations. What if their expectations were that “online learning is going to be stink out loud,” would we be happy with a score of 4 for meeting those expectations? I think it is dangerous (and extremely presumptuous) to think that students came into online learning with high expectations. Is there any data to support this?

PSOL expectations

Could the differences in these columns shown above be caused primarily due to different expectations? I think that’s entirely possible. Even still, every group reports a better experience (above 4.0) than they expected, whatever those expectations might be.

Sources of Information

Questions 37-43 on the PSOL simply gather information about how important the different sources of information are to students when they are looking for information about online programs. Not surprisingly, campus web sites and online catalogs rank highly in importance, while printed catalogs and college representatives (recruiters, etc.) rank much lower.

By far the lowest importance rankings are reserved  for advertisements. I actually question the validity of the low scores on advertisements. I agree that they are not deserving of high rankings, but I think that part of the reason of the very low rankings is that most people (especially students) don’t want to admit that they might have been influenced by an advertisement or promotion.

I think this is interesting since most people in higher ed that I know claim that the main reason that there are over 200,000 students in University of Phoenix is because they are a slick marketing machine. So either students underestimate the importance of marketing/advertisement or everyone needs to come up with another reason why so many students enroll at U of Phx.
PSOL Sources of Information Chart

Population Differences

The chart below shows some of the normal differences that you can expect to see in the satisfaction levels of different groups of students.

Satisfaction scores chart

These four questions were among the top rated as far as importance for Lake Superior College students in the FY06 survey administration. The chart indicates the satisfaction scores on these four important factors. In each cluster, the bright red column indicates the overall LSC Online score for student satisfaction. The two taller columns (orange and yellow) indicate two demographic groups that are consistently more satisfied than their counterparts indicated in the two shades of blue.

In particular, the bright blue column represents those students 24 years and under while the next column (orange-ish) represents those students 25 years and over. As previously reported, the older students are more satisfied than the younger students. The next two columns indicate those who self-report as being “primarily online” students (yellow column) and those who consider themselves to be primarily “on-campus” students (aqua column) but are taking one or more online courses. It is not surprising that the primarily online students are more satisfied with online learning.

I presented this data previously so it is nothing new, I was simply experimenting with another way to visually represent the differences. Keep in mind that a 5.0 is somewhat satisfied, a score of 6.0 is satisfied, and a 7.0 is extremely satisfied. Even though there are significant differences, the lowest score on that chart is 5.31 which is somewhere between somewhat satisfied and satisfied.

The other thing to note is that not only are there differences in satisfaction, but there are similar differences in the level of importance placed on these items by the different groups. The chart below shows these same four items with the importance scores indicated for the same demographics groups. Once again you can easily see that the older students and the primarily online students place a much higher level of importance on these factors than their counterparts.

PSOL Importance scores

Click on either image to view a larger version.