Although only a slight improvement this year, this continues the year-over-year improvement that can be seen by looking at the average satisfaction scores for the 26 basic items in the PSOL.
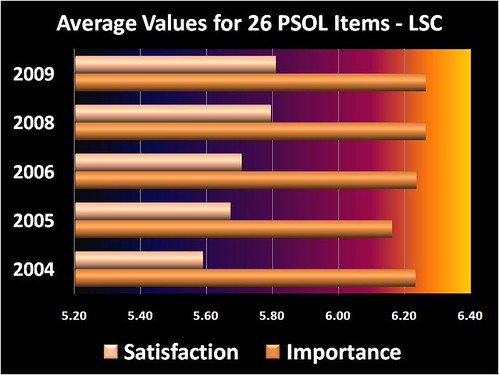
Although only a slight improvement this year, this continues the year-over-year improvement that can be seen by looking at the average satisfaction scores for the 26 basic items in the PSOL.
These slides show the comparisons between our 2008 PSOL results and the 2008 SSI (student Satisfaction Inventory) results. There are eleven questions that match up between the two surveys, including some that we added for that very purpose.
[slideshare id=591501&doc=psolssi2008charts-1221054827135496-8&w=425]
To clarify: here are the questions that were compared from the two groups.
| PSOL # | SSI # | Item |
| 01 | 45 | This institution has a good reputation. |
| 04 | 46 | Faculty provide timely feedback about student progress. |
| 07 | 66 | Program requirements are clear and reasonable. |
| 09 | 07 | Adequate financial aid is available. |
| 20 | 18 | The quality of (online) instruction is excellent. |
| 21 | 14 | (Online) Library resources and services are adequate. |
| 23 | 52 | Billing and payment procedures are convenient for me. |
| 24 | 50 | Tutoring services are readily available (for online courses). |
| 32 | 23 | Faculty are understanding of students’ unique life circumstances. |
| 34 | 32 | My academic advisor is knowledgeable about my program requirements. |
| 36 | 75 | The LSC Help Desk responds with useful information and solutions. |
Once again, Minnesota Online will be sponsoring the use of the PSOL for all interested schools in the Minnesota State Colleges and Universities. LSC will be participating again this year after taking last year off. The survey will be available to students in February and we will likely have the results in the latter part of March.
This will be our fourth time gathering data with this instrument. The previous three years have provided us with a good baseline on which to judge future changes in importance and satisfaction to the online students. We have five optional questions where we can ask any additional items that we see fit. We are planning on trying to match most or all of those five questions with similar questions on the N-L Student Satisfaction Inventory (SSI). The SSI is a similar survey that will be given this spring to our on-campus students. This will give us even additional data with which to compare the satisfaction of our online students with our on-ground students.
 It’s one thing to get the data about importance to students and their related levels of satisfaction, it’s quite another to be able to do anything about those things. On the one hand you might have an opportunity to manage student expectations which could possibly affect either importance or satisfaction, or both. On the other hand, you might be able to improve services and affect satisfaction scores in a positive way.
On the third hand, there might not be much that you can do at all, at least not without a long time horizon, lots of patience, and maybe lots of money. As I look at our results of the PSOL, I believe that there are four items where we don’t have much of an opportunity to affect results. They are as follows:
01. This institution has a good reputation.
06. Tuition paid is a worthwhile investment.
08. Student-to-student collaborations are valuable to me.
09. Adequate financial aid is available.
College reputations are not built or destroyed overnight. It may be nice to know what your students think about your reputation, but there might not be too much that you can do about it. I suppose you could start an internal promotional campaign designed to convince your current students that you really are much better than they think, but that seems silly, self-serving, and somewhat pathetic.
Convincing students that their tuition dollars are being well spent is also a rather futile exercise in my opinion. Even though that may be true, many people think that there is always a better deal right around the corner. The grass is always greener somewhere else which means that tuition is always cheaper elsewhere or the quality is better or both. Good luck trying to convince students (or any consumers) that they have misjudged the value in what they’re paying for.
Student-to-student collaboration? I’ve already posted about that a couple of times. It’s a bit of a strange question for students to assess, especially on the satisfaction scale. My satisfaction with collaborations is more a function of who the collaborators are rather than something that the institution can control.
Finally, adequate financial aid? Are you kidding me? The only adequate financial aid for many people is something that covers all their expenses (that includes beer money) and doesn’t have to be paid back. Short of that they will rate financial aid adequacy as extremely important and satisfaction level as quite low. Again, this begs the question of what the institution can possibly do about the huge gap between the importance and satisfaction scores here. Start giving away money in the hallways? I doubt it.
All told, only four out of 26 survey items that you have very little control over isn’t too bad. The other items I believe that you either have a great deal or a moderate amount of control over, or ability to influence in the short term of 1-3 year. Those are the items where you may be able to see some increases in your survey results if you pick your strategies wisely.
(What does the Washington Monument have to do with this post? Nuthin’. I just like it and it’s mine, so why not?)
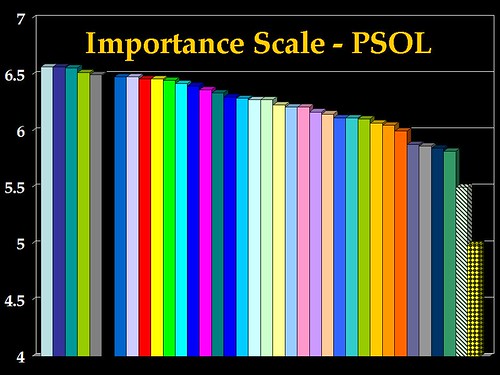
I’ve been asked to supply some data backing up my claim that students place a low level of importance on the idea of developing a sense of community in their e-learning opportunities. I have spoken about this at various times, including three days ago during a keynote presentation about the myths and realities of e-Learning (titled “e-Learning Mythbusters”). Above is a slide from that presentation. Showing 36 items on a slide is generally not a good approach, but this was intended to illustrate how the last two items on the far-right are significantly less important to students than the other 34 items.
There is only one question on the PSOL that seems to get at the issue of building community (sort of). Question #8 reads as follows: “Student-to-student collaborations are valuable to me.” This question probably involves more things than just building community, since student-to-student collaborations means very different things in different courses or programs. However, the fact remains that this question scores incredibly poorly on the importance scale. There are 26 importance/satisfaction questions on the PSOL (36 if you add 10 of your own, more on that below). Of the 26 questions, this one scores at #26 on the importance scale, and it’s not even close to number 25. This statement is shown in the last column (yellow-black checkered) of the 36 columns in the slide (that is LSC data with 10 added statements for a total of 36).
Since that question doesn’t directly measure the idea of “community,” we have added a question to our survey in two of the three annual administrations at LSC. We added the following statement: “I feel of sense of community or belonging through the LSC Virtual Campus.” With the 10 added statements, there are now 36 statements in total. This added item comes out as #35, with the student-to-student collaborations coming in at #36 and the lowest level of importance. The “sense of community” statement is shown in the chart as next-to-last column (black-white striped).
Interpreting the results is always a bit of a crapshoot at best, but here’s my take on why this is rated lowly by the students. Think of your typical online student. At my school, our online students are typically raising a family, working at one or two jobs, and in many other ways not your typical “captured” college student. In other words, they are already heavily involved in several “communities” that are very important to them – work(1), work(2), kid’s school, church, neighborhood, friends, etc. etc. For many people, the idea of developing another community (takes time and commitment) is just a bit too much to ask. One reason that they are drawn to e-Learning in the first place is because their lives are very full and heavily scheduled. They want to get their coursework done and meet deadlines (okay, that’s not always true). Building community in their e-learning takes time that they prefer to spend in other pursuits.
One more take on all this, which I believe is especially true of the younger e-learners out there. They spend a great deal of time building online community in their social networking (Facebook, MySpace, etc.). The last thing they want is for their e-Learning to look like their social networking. They are sending a message to us when they tell educators to stay out of their social networking spaces. We also need to recognize the amount of informal learning that takes place outside of the e-Learning environment. Of course, we haven’t figured out how to do that yet.
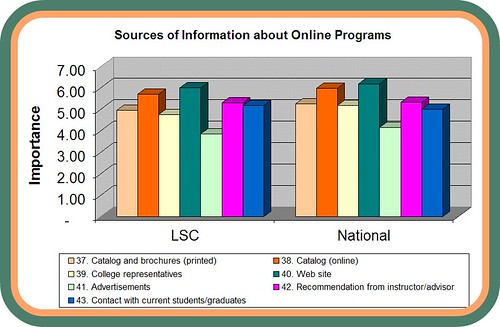
Questions 37-43 on the PSOL simply gather information about how important the different sources of information are to students when they are looking for information about online programs. Not surprisingly, campus web sites and online catalogs rank highly in importance, while printed catalogs and college representatives (recruiters, etc.) rank much lower.
By far the lowest importance rankings are reserved for advertisements. I actually question the validity of the low scores on advertisements. I agree that they are not deserving of high rankings, but I think that part of the reason of the very low rankings is that most people (especially students) don’t want to admit that they might have been influenced by an advertisement or promotion.
I think this is interesting since most people in higher ed that I know claim that the main reason that there are over 200,000 students in University of Phoenix is because they are a slick marketing machine. So either students underestimate the importance of marketing/advertisement or everyone needs to come up with another reason why so many students enroll at U of Phx.
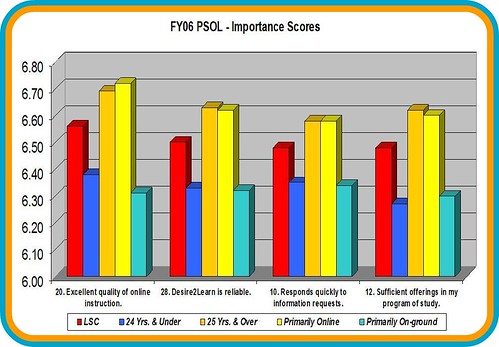
The chart below shows some of the normal differences that you can expect to see in the satisfaction levels of different groups of students.
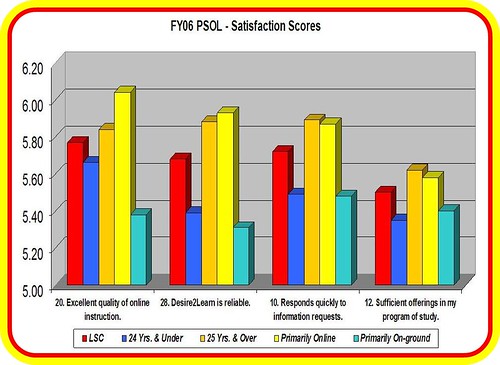
These four questions were among the top rated as far as importance for Lake Superior College students in the FY06 survey administration. The chart indicates the satisfaction scores on these four important factors. In each cluster, the bright red column indicates the overall LSC Online score for student satisfaction. The two taller columns (orange and yellow) indicate two demographic groups that are consistently more satisfied than their counterparts indicated in the two shades of blue.
In particular, the bright blue column represents those students 24 years and under while the next column (orange-ish) represents those students 25 years and over. As previously reported, the older students are more satisfied than the younger students. The next two columns indicate those who self-report as being “primarily online” students (yellow column) and those who consider themselves to be primarily “on-campus” students (aqua column) but are taking one or more online courses. It is not surprising that the primarily online students are more satisfied with online learning.
I presented this data previously so it is nothing new, I was simply experimenting with another way to visually represent the differences. Keep in mind that a 5.0 is somewhat satisfied, a score of 6.0 is satisfied, and a 7.0 is extremely satisfied. Even though there are significant differences, the lowest score on that chart is 5.31 which is somewhere between somewhat satisfied and satisfied.
The other thing to note is that not only are there differences in satisfaction, but there are similar differences in the level of importance placed on these items by the different groups. The chart below shows these same four items with the importance scores indicated for the same demographics groups. Once again you can easily see that the older students and the primarily online students place a much higher level of importance on these factors than their counterparts.
Click on either image to view a larger version.
![]() In July 2006 I attended the annual Noel-Levitz conference in Denver. The first day was a client workshop on the various N-L surveys of student satisfaction and importance, such as the SSI (Student Satisfaction Inventory) and the PSOL (Priorities Survey for Online Learners). They had just updated the overall results for the PSOL. There are now just over 34,000 student survey submissions from 78 institutions. This is approximately a doubling in the number of records since the 2005 data was released. Here are a few of the demographics of this national group of online learners:
In July 2006 I attended the annual Noel-Levitz conference in Denver. The first day was a client workshop on the various N-L surveys of student satisfaction and importance, such as the SSI (Student Satisfaction Inventory) and the PSOL (Priorities Survey for Online Learners). They had just updated the overall results for the PSOL. There are now just over 34,000 student survey submissions from 78 institutions. This is approximately a doubling in the number of records since the 2005 data was released. Here are a few of the demographics of this national group of online learners:
Those numbers include a little less than 3,000 students from MnOnline who completed the survey during Feb-Mar of 2006.
Technorati Tags: PSOL, Noel-Levitz
Noel-Levitz surveys are generally of very high quality and the PSOL fits that description. It is the only nationally-normed satisfaction survey that focuses on the online learners that I was aware of when we first used it in 2004. Using it three years in a row gave us a good baseline for measuring overall satisfaction and also for monitoring changes in satisfaction over time. We had tried to use a survey developed internally but found the survey results to be of limited usefulness since we had no comparison data.
The PSOL is made up of various types of questions. A PDF of the survey is available here. Please keep in mind that this survey is the copyrighted property of Noel-Levitz.
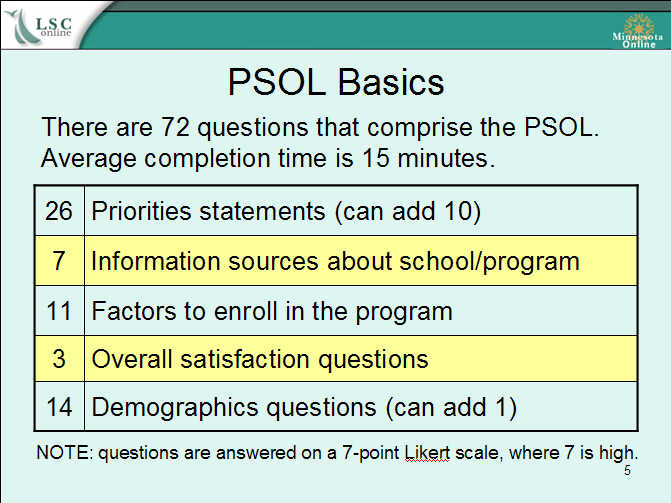
The most useful information comes from the 36 Priorities questions. There are 26 standard questions (used for national averages) and you can add 10 more campus-specific questions. For each of these 36 questions, students indicate both (A) how important the item is to them and (B) how satisfied they are with that item.
It is this comparison of Importance/Satisfaction that is the focus of planning for areas to make the most meaningful improvement in services or information.