The chart below shows some of the normal differences that you can expect to see in the satisfaction levels of different groups of students.
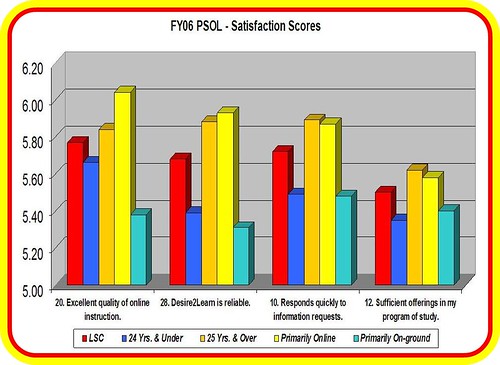
These four questions were among the top rated as far as importance for Lake Superior College students in the FY06 survey administration. The chart indicates the satisfaction scores on these four important factors. In each cluster, the bright red column indicates the overall LSC Online score for student satisfaction. The two taller columns (orange and yellow) indicate two demographic groups that are consistently more satisfied than their counterparts indicated in the two shades of blue.
In particular, the bright blue column represents those students 24 years and under while the next column (orange-ish) represents those students 25 years and over. As previously reported, the older students are more satisfied than the younger students. The next two columns indicate those who self-report as being “primarily online” students (yellow column) and those who consider themselves to be primarily “on-campus” students (aqua column) but are taking one or more online courses. It is not surprising that the primarily online students are more satisfied with online learning.
I presented this data previously so it is nothing new, I was simply experimenting with another way to visually represent the differences. Keep in mind that a 5.0 is somewhat satisfied, a score of 6.0 is satisfied, and a 7.0 is extremely satisfied. Even though there are significant differences, the lowest score on that chart is 5.31 which is somewhere between somewhat satisfied and satisfied.
The other thing to note is that not only are there differences in satisfaction, but there are similar differences in the level of importance placed on these items by the different groups. The chart below shows these same four items with the importance scores indicated for the same demographics groups. Once again you can easily see that the older students and the primarily online students place a much higher level of importance on these factors than their counterparts.
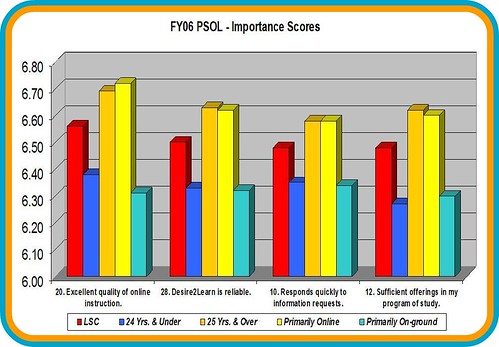
Click on either image to view a larger version.