Category Archives: 2006 PSOL

Meeting Expectations

One of the important things to do with your PSOL data is to look at the gaps – the differences between the iMind the Gapmportance ratings and the satisfaction ratings expressed by the students. You’re always concerned about the larger gaps which indicate where you have significant room for improvement, if it is an item where you have much control over (or impact upon) the level of student satisfaction.

At the same time, I like to look at the smaller gaps. You also need to have some positive reinforcement for those things that are going very well – for those things where you are essentially meeting the student expectations. The seven items listed below come from the 26 standard items on the PSOL and indicate the lowest performance gaps for Lake Superior College in the FY06 satisfaction survey. The item number is shown first, followed by the full text of the item, and then the size of the gap (importance score minus satisfaction score).

08. Student-to-student collaborations are valuable to me = (.42)
This one is always interesting (see previous post about this item) because the students are basically telling you something like this: “I really don’t care much about this, but you’re doing a pretty good job with it!” This item has a decent (not great) satisfaction rating, but it has an extremely low importance score.

01. This institution has a good reputation = .02
This item is interesting to me because it tells me that we are serving the proper audience. Our students know who we are and what we can do for them. For the national numbers, the importance score is much higher than ours, which is why the national gap was .39 while ours was only .02. The satisfaction scores were almost identical, but reputation is more important to more of the students in the national survey. Keep in mind that many of those students are graduate students and have a very different demographic than our students.

18. Registration for online courses is convenient = .14
We have a low gap here because our registration system is completely online and has been for several years. It is managed by the state system (MnSCU) and seems to meet students’ needs quite effectively. This is always one of the most important survey items for students, but one with consistently high satisfaction scores.

21. Adequate online library resources are provided = .33
For several years now we have had significant online library resources available to all students. Our biggest issue is in getting them to use the resources, not whether the resources are online or not.

24. Tutoring services are readily available for online courses = .33
We are currently in our fifth year of offering online tutoring services through SMARTHINKING. We have always scored highly in this category, but you also have to keep in mind that only 10-15% of the students use tutoring services (either online or on-ground) and so the importance score is one of the lowest on the survey.

23. Billing and payment procedures are convenient for me. = .35
Much like our online registration, the billing and payment function is managed centrally for all 32 institutions. This is an item with a high importance score, but also a high satisfaction score.

19. Online career services are available = .35
This last one also is not very important to many of our online students, since so many of our online students are transfer students working on an A.A. degree of the Minnesota Transfer Curriculum. Our gap is low because this is not a hot topic for most of our students.

For me, the takeaways here are as follows:

  1. Small performance gaps are often the result on items where the student ratings indicate a low importance score. That is the case for items 1, 8, 19, and 24 above. All four of those items have an importance score below 6.0 which generally indicates that most students rate them somewhere between “slightly important” and “important.”
  2. Small performance gaps on the other three items (18, 21, and 23) indicate areas where you are really meeting the needs of the students. These items have high importance scores (above 6.0) and high satisfaction scores. These are things to be proud of.
  3. Gap analysis is not an exact science. It is only a starting point in looking for places where you may be able to improve the services that are being offered to students.

(CC Flickr photo by Annie Mole)

Sense of Community

2006 PSOL IMPORTANCE RESULTS

I’ve been asked to supply some data backing up my claim that students place a low level of importance on the idea of developing a sense of community in their e-learning opportunities. I have spoken about this at various times, including three days ago during a keynote presentation about the myths and realities of e-Learning (titled “e-Learning Mythbusters”). Above is a slide from that presentation. Showing 36 items on a slide is generally not a good approach, but this was intended to illustrate how the last two items on the far-right are significantly less important to students than the other 34 items.

There is only one question on the PSOL that seems to get at the issue of building community (sort of). Question #8 reads as follows: “Student-to-student collaborations are valuable to me.” This question probably involves more things than just building community, since student-to-student collaborations means very different things in different courses or programs. However, the fact remains that this question scores incredibly poorly on the importance scale. There are 26 importance/satisfaction questions on the PSOL (36 if you add 10 of your own, more on that below). Of the 26 questions, this one scores at #26 on the importance scale, and it’s not even close to number 25. This statement is shown in the last column (yellow-black checkered) of the 36 columns in the slide (that is LSC data with 10 added statements for a total of 36).

  • For the national results, question #8 has an importance score of 5.16. (Note: 5.0 is somewhat important)
  • For the LSC peer group institutions, #8 has an importance score of 5.17.
  • For Lake Superior College, #8 has an importance score of 5.00.
  • For Minnesota Online schools, #8 has an importance score of 4.93.

Since that question doesn’t directly measure the idea of “community,” we have added a question to our survey in two of the three annual administrations at LSC. We added the following statement: “I feel of sense of community or belonging through the LSC Virtual Campus.” With the 10 added statements, there are now 36 statements in total. This added item comes out as #35, with the student-to-student collaborations coming in at #36 and the lowest level of importance. The “sense of community” statement is shown in the chart as next-to-last column (black-white striped).

  • In year 1 (FY04) at LSC, we didn’t include this statement on the survey. (no added questions)
  • In year 2 (FY05) at LSC, this item scored 5.16 on the importance scale (35 out of 36)
  • In year 3 (FY06) at LSC, this item scored 5.50 on the importance scale (35 out of 36)

Interpreting the results is always a bit of a crapshoot at best, but here’s my take on why this is rated lowly by the students. Think of your typical online student. At my school, our online students are typically raising a family, working at one or two jobs, and in many other ways not your typical “captured” college student. In other words, they are already heavily involved in several “communities” that are very important to them – work(1), work(2), kid’s school, church, neighborhood, friends, etc. etc. For many people, the idea of developing another community (takes time and commitment) is just a bit too much to ask. One reason that they are drawn to e-Learning in the first place is because their lives are very full and heavily scheduled. They want to get their coursework done and meet deadlines (okay, that’s not always true). Building community in their e-learning takes time that they prefer to spend in other pursuits.

One more take on all this, which I believe is especially true of the younger e-learners out there. They spend a great deal of time building online community in their social networking (Facebook, MySpace, etc.). The last thing they want is for their e-Learning to look like their social networking. They are sending a message to us when they tell educators to stay out of their social networking spaces. We also need to recognize the amount of informal learning that takes place outside of the e-Learning environment. Of course, we haven’t figured out how to do that yet.

Student Expectations

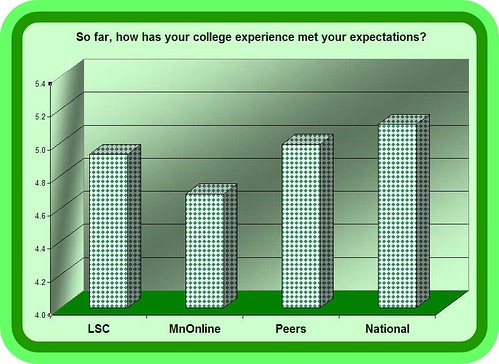
Question 55 on the PSOL is one of three “Summary” questions that are placed near the end of the survey. Question 55 is a difficult question to make sense out of. It reads as follows: “So far, how has your college experience met your expectations?”

An earlier version of the survey appears to have included a slightly different question: “So far, how has the online experience met your expectations?” I actually prefer this older version of the question. Since we have students take this survey even if they are primarily on-ground students, their “college experience” can be quite different from their “online experience.”

Here are the possible responses to this question:

  1. Much worse than I expected
  2. Quite a bit worse than I expected
  3. Worse than I expected
  4. About what I expected
  5. Better than I expected
  6. Quite a bit better than I expected
  7. Much better than I expected

On the satisfaction and importance scales, a score of “4” equals a neutral rating. Here a score of 4 equals “about what I expected.” Those are not the same things, or at least we have no way of knowing whether they might be about the same or wildly different.

The problem with this measure is that we have no idea what the student expectations WERE coming into the online learning experience. Meeting their expectations might be a great thing if they had high expectation, but clearly it could be a bad thing if they very low expectations. What if their expectations were that “online learning is going to be stink out loud,” would we be happy with a score of 4 for meeting those expectations? I think it is dangerous (and extremely presumptuous) to think that students came into online learning with high expectations. Is there any data to support this?

PSOL expectations

Could the differences in these columns shown above be caused primarily due to different expectations? I think that’s entirely possible. Even still, every group reports a better experience (above 4.0) than they expected, whatever those expectations might be.

Population Differences

The chart below shows some of the normal differences that you can expect to see in the satisfaction levels of different groups of students.

Satisfaction scores chart

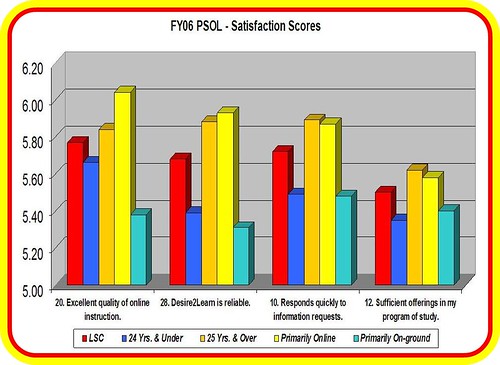
These four questions were among the top rated as far as importance for Lake Superior College students in the FY06 survey administration. The chart indicates the satisfaction scores on these four important factors. In each cluster, the bright red column indicates the overall LSC Online score for student satisfaction. The two taller columns (orange and yellow) indicate two demographic groups that are consistently more satisfied than their counterparts indicated in the two shades of blue.

In particular, the bright blue column represents those students 24 years and under while the next column (orange-ish) represents those students 25 years and over. As previously reported, the older students are more satisfied than the younger students. The next two columns indicate those who self-report as being “primarily online” students (yellow column) and those who consider themselves to be primarily “on-campus” students (aqua column) but are taking one or more online courses. It is not surprising that the primarily online students are more satisfied with online learning.

I presented this data previously so it is nothing new, I was simply experimenting with another way to visually represent the differences. Keep in mind that a 5.0 is somewhat satisfied, a score of 6.0 is satisfied, and a 7.0 is extremely satisfied. Even though there are significant differences, the lowest score on that chart is 5.31 which is somewhere between somewhat satisfied and satisfied.

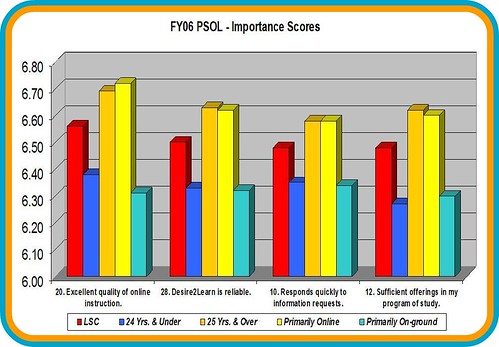
The other thing to note is that not only are there differences in satisfaction, but there are similar differences in the level of importance placed on these items by the different groups. The chart below shows these same four items with the importance scores indicated for the same demographics groups. Once again you can easily see that the older students and the primarily online students place a much higher level of importance on these factors than their counterparts.

PSOL Importance scores

Click on either image to view a larger version.

PSOL Aggregations

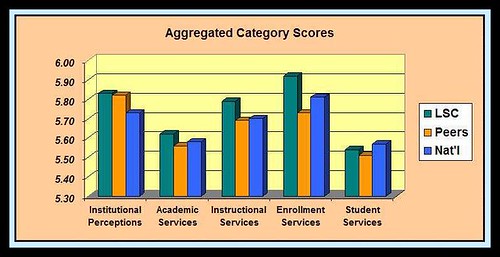
For the PSOL, Noel-Levitz creates five categories from the 26 core items that have both a satisfaction and importance score. Those five categories are:

  1. Academic services (7)
  2. Enrollment services (4)
  3. Institutional perceptions (2)
  4. Instructional services (8)
  5. Student services (5)

In each of these categories, there are two or more questions (indicated in parentheses above) that are combined to create the aggregate score.

Column chart of PSOL results

This column chart shows the LSC scores as compared to both the peer group of 13 similar two-year schools as well as the national results from more than 60 schools. Our best performance is in the Enrollment Services category and our largest opportunity for improvement is in the Student Services category.

To really make any improvements in these rankings you must look at the underlying specific survey items and attempt to improve services or otherwise improve the level of satisfaction expressed by the students. These are the five questions that comprise the Student Services category score:

  • 10. This institution responds quickly when I request information. (Our score here is good!)
  • 15. Channels are available for providing timely responses to student complaints.
  • 19. Online career services are available.
  • 22. I am aware of whom to contact for questions about programs and services.
  • 26. The bookstore provides timely service to students. (NOT considered to be Student Services on our campus.)

Peer Group Demographics

I posted recently about our 13-school peer comparison group for the 2006 PSOL and how this would be our best group for benchmarking since they are all two year schools. It is also necessary to look a little deeper to make sure that the respondents are similar so I compared the demographics of the two groups.

  • Ours were 81.6% female, theirs were 78.7% female. Females generally give more favorable satisfaction ratings on such surveys (unless they are being surveyed about their husbands).
  • Ours were 46.2% age 24 and under, theirs were 34.2% in that age range. Younger students tend to give lower satisfaction ratings than the older age groups.
  • 58.2% of ours indicated that they were primarily online students, compared to 59.7% of theirs. It has been my experience that those who identify themselves as mainly online tend to look more favorably upon their experience learning online than those who consider themselves to be primarily on-campus learners just taking an online course or two.
  • 61.2% of our students indicated that they are taking full-time class loads, compared to 47.1% of the peer group students. Part-time students tend to rate their satisfaction more highly than full-time students.
  • It was almost a draw for the percentage indicating that their educational goal was to complete an online degree program: 21.9% for us and 22.7% for them.
  • Even more of a draw for the percentage indicating that their educational goal was to complete an on-campus degree program: 34.7% for us and 35.0% for them.
  • For our students, 62.1% indicated that they had taken 0-3 previous online courses, while 75% of the peer group had that same level of previous experience. From a pure logic perspective (or maybe it is common sense), those with more experience with online courses tend to have higher satisfaction ratings, with the best measure of their satisfaction being their continued enrollment in more online courses.

Therefore, the question to be answered is whether our student group would tend to be more favorable than the peer student group. Here is my opinion:

  • Gender: slight bias in favor of high LSC satisfaction ratings, but not much.
  • Age: significant bias against high LSC satisfaction ratings.
  • Primarily online: no significant difference.
  • Part-time class loads: significant bias against high LSC satisfaction ratings.
  • Educational goal: no significant difference.
  • Previous online experience: significant bias in favor of high LSC satisfaction ratings.

The net result? I’d call it a draw, although really I think that there is a slight demographic bias against favorable satisfaction ratings for LSC compared to the peer group. The fact is that the LSC student satisfaction ratings were significantly higher than the peer group ratings. I’m arguing here that those are real differences, not caused by survey respondent biases. The first chart below shows how the LSC online students answered the questions about current plans/reasons for taking one or more online courses. The second chart is for the peer group of students.


Current Plans - LSC Students - http://zohosheet.com


Current Plans - Peer Group - http://zohosheet.com

2006 PSOL Strengths

PSOL Strengths for Lake Superior College

Our 2006 Institutional report for the Noel-Levitz PSOL identified the following strengths for LSC Online (listed in rank order beginning with the strongest item).

I’ve had a few discussions with Noel-Levitz representatives about how I think the “strengths” need to be redefined. Right now the strengths are what I would call “internal strengths,” without considering whether they are strengths in the larger context of the e-learning environment, or at least of the schools that have used this instrument.

  • 11. Student assignments are clearly defined in the syllabus.
  • 18. Registration for online courses is convenient.
  • 33. Logging-in (managing usernames and passwords) for various services across the campus is easy and consistent. (Campus item 7)
  • 6. Tuition paid is a worthwhile investment.
  • 25. Faculty are responsive to student needs.
  • 7. Program requirements are clear and reasonable.
  • 3. Instructional materials are appropriate for program content. **
  • 23. Billing and payment procedures are convenient for me.
  • 13. The frequency of student and instructor interactions is adequate.

** Note: I am not willing to consider this a strength since our satisfaction score is slightly below (-.03) the national average for this item. Strengths are defined as those items above the mid-point in importance and in the top quartile of satisfaction, for your institution only. In other words, it is possible to have something identified as a strength when it is not a very favorable score, such as falling below the national average. I have a hard time seeing that as a strength. To really consider something as a strength, I believe that it must be both an internal strength (as defined by Noel-Levitz) and an external strength which means that it exceeds the performance level of the national group or preferably it exceeds the performance of a peer group (as defined by me).

Technorati Tags: , ,

PSOL Peer Group

On September 13, 2006, I received new data from Noel-Levitz regarding the PSOL (Priorities Survey for Online Learners) that we gave for the third year in a row during spring semester 2006. The data have always been useful but the report received today is the most useful for benchmarking that we have ever received.

Coming from a two-year public institution, our comparisons with the national results were interesting but not terribly useful for benchmarking purposes. Many of the schools included in the national results are very dissimilar from LSC. It includes graduate schools, for-profit schools, schools that are completely online (not blended as we are with both F2F and online), and overall just a hodge-podge of different schools that have used the survey during the past several years.

This spring we received better data because 16 of our sister institutions in MnOnline also gave the same survey at the same time. This was definitely better because it gave us comparison data with a group of schools from our own system. However, that still compares us with the state universities as well as some two-year schools who aren’t as experienced as we are at providing online learning and services. Also, no one really wants to talk about the consortium data because the aggregated student satisfaction levels are really quite low.

So, this new report from Noel-Levitz (that we paid for) compares the LSC results with a peer group of 13 two-year institutions from throughout the country. Approximately 3,900 student responses comprise the peer group and they come from a mixture of traditional community colleges as well as technical colleges, much like how LSC is a combined community and technical college.

On the 26 standard items on the PSOL, LSC students were more satisfied on 19 of the items and less satisfied on 7. Even more importantly, there were six of the 26 items where the difference in satisfaction levels were statistically significant. On all six of those items, the LSC score was much higher than the peer group score.

Below I’ll post a couple of charts that show some of the data comparing the LSC “Primarily Online” students with the similar group from the peer group institutions. The first chart shows the three most significant differences (.001 level) from that data set.

LSC vs. Peer Group - http://www.zohosheet.com

The second chart shows the two items that were significant at the .01 level, again coming from the “Primarily Online” segment of the data pool. FY06 Noel-Levitz PSOL: LSC vs. Peer Group - http://www.zohosheet.com The third and final chart shows the four items that were significant at the .05 level. This data set of primarily online students had nine total differences that were significant, and all nine were positive differences for LSC.

FY06 Noel-Levitz PSOL: LSC vs. Peer Group - http://www.zohosheet.com

Charts made with ZohoSheet.

Technorati Tags: , , ,

2006 Noel-Levitz Conference

Noel-LevitzIn July 2006 I attended the annual Noel-Levitz conference in Denver. The first day was a client workshop on the various N-L surveys of student satisfaction and importance, such as the SSI (Student Satisfaction Inventory) and the PSOL (Priorities Survey for Online Learners). They had just updated the overall results for the PSOL. There are now just over 34,000 student survey submissions from 78 institutions. This is approximately a doubling in the number of records since the 2005 data was released. Here are a few of the demographics of this national group of online learners:

  • Female: 68%, Male: 32%

  • Age Distribution:
    • 24 & under: 19%
    • 25-34 years: 30%
    • 35-44 years: 27%
    • 45 & older: 24%

  • Current Enrollment:

    • primarily online: 82%
    • primarily on-ground: 18%

  • Class load:

    • Full-time 57%
    • Part-time: 43%

  • Employment:

    • full-time: 71%
    • part-time: 16%
    • not employed: 13%

  • Educational goal:
    • Associate degree: 14%
    • Bachelor: 34%
    • Master: 26%
    • Doctorate: 22%

  • Current online enrollment:

    • 1-3 credits: 27%
    • 4-6 credits: 34%
    • 7-9 credits: 16%
    • 10-12 credits: 12%
    • 13 or more credits: 11%

  • Previous online enrollment:

    • no classes: 25%
    • 1-3 classes: 37%
    • 4-6 classes: 15%
    • 7-9 classes: 8%
    • 10 or more: 15%

Those numbers include a little less than 3,000 students from MnOnline who completed the survey during Feb-Mar of 2006.

Technorati Tags: ,