Monthly Archives: March 2007

Sources of Information

Questions 37-43 on the PSOL simply gather information about how important the different sources of information are to students when they are looking for information about online programs. Not surprisingly, campus web sites and online catalogs rank highly in importance, while printed catalogs and college representatives (recruiters, etc.) rank much lower.

By far the lowest importance rankings are reserved  for advertisements. I actually question the validity of the low scores on advertisements. I agree that they are not deserving of high rankings, but I think that part of the reason of the very low rankings is that most people (especially students) don’t want to admit that they might have been influenced by an advertisement or promotion.

I think this is interesting since most people in higher ed that I know claim that the main reason that there are over 200,000 students in University of Phoenix is because they are a slick marketing machine. So either students underestimate the importance of marketing/advertisement or everyone needs to come up with another reason why so many students enroll at U of Phx.
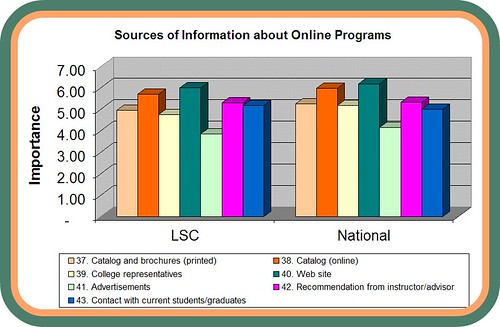
PSOL Sources of Information Chart

Population Differences

The chart below shows some of the normal differences that you can expect to see in the satisfaction levels of different groups of students.

Satisfaction scores chart

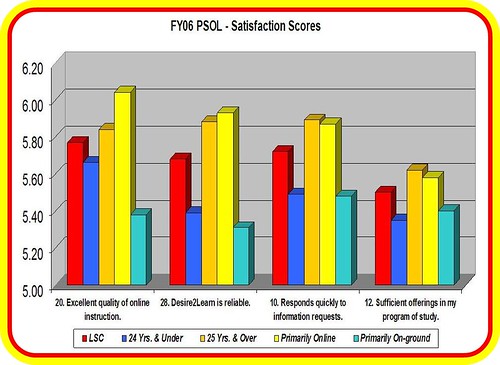
These four questions were among the top rated as far as importance for Lake Superior College students in the FY06 survey administration. The chart indicates the satisfaction scores on these four important factors. In each cluster, the bright red column indicates the overall LSC Online score for student satisfaction. The two taller columns (orange and yellow) indicate two demographic groups that are consistently more satisfied than their counterparts indicated in the two shades of blue.

In particular, the bright blue column represents those students 24 years and under while the next column (orange-ish) represents those students 25 years and over. As previously reported, the older students are more satisfied than the younger students. The next two columns indicate those who self-report as being “primarily online” students (yellow column) and those who consider themselves to be primarily “on-campus” students (aqua column) but are taking one or more online courses. It is not surprising that the primarily online students are more satisfied with online learning.

I presented this data previously so it is nothing new, I was simply experimenting with another way to visually represent the differences. Keep in mind that a 5.0 is somewhat satisfied, a score of 6.0 is satisfied, and a 7.0 is extremely satisfied. Even though there are significant differences, the lowest score on that chart is 5.31 which is somewhere between somewhat satisfied and satisfied.

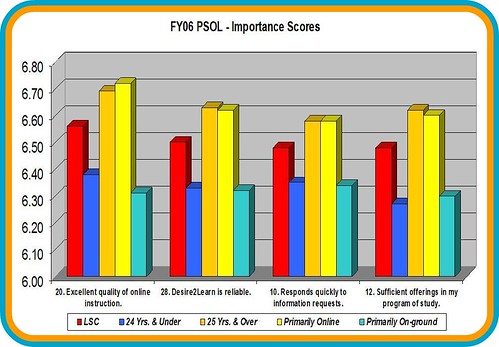
The other thing to note is that not only are there differences in satisfaction, but there are similar differences in the level of importance placed on these items by the different groups. The chart below shows these same four items with the importance scores indicated for the same demographics groups. Once again you can easily see that the older students and the primarily online students place a much higher level of importance on these factors than their counterparts.

PSOL Importance scores

Click on either image to view a larger version.

PSOL Aggregations

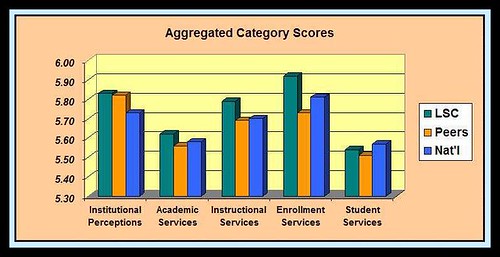
For the PSOL, Noel-Levitz creates five categories from the 26 core items that have both a satisfaction and importance score. Those five categories are:

  1. Academic services (7)
  2. Enrollment services (4)
  3. Institutional perceptions (2)
  4. Instructional services (8)
  5. Student services (5)

In each of these categories, there are two or more questions (indicated in parentheses above) that are combined to create the aggregate score.

Column chart of PSOL results

This column chart shows the LSC scores as compared to both the peer group of 13 similar two-year schools as well as the national results from more than 60 schools. Our best performance is in the Enrollment Services category and our largest opportunity for improvement is in the Student Services category.

To really make any improvements in these rankings you must look at the underlying specific survey items and attempt to improve services or otherwise improve the level of satisfaction expressed by the students. These are the five questions that comprise the Student Services category score:

  • 10. This institution responds quickly when I request information. (Our score here is good!)
  • 15. Channels are available for providing timely responses to student complaints.
  • 19. Online career services are available.
  • 22. I am aware of whom to contact for questions about programs and services.
  • 26. The bookstore provides timely service to students. (NOT considered to be Student Services on our campus.)

Age Differences

In the previous post I suggested that we needed to compare the demographics of the LSC PSOL students with the students in the peer group to see if there were any significant differences which might make the results not perfectly comparable. My conclusion was that there are several demographic factors where the groups differ, but in total they appear to just about even out without a huge bias either in favor of or fighting against one group or the other.

One of the factors of possible differences has to do with the larger percentage of younger online learners (46.2% vs. 34.2%) that we have at LSC. At the Noel-Levitz conference this summer I learned that their research has shown that the younger students generally show significantly lower satisfaction rates than the older students. It finally occurred to me that I do have the data to study for evidence of this phenomenon, at least for the LSC students.

The LSC data does show a huge difference between the two groups of learners. Those 24 years and younger are less satisfied than those 25 years and older on all but one of the 36 items ranked for both importance and satisfaction. The only item where younger students are more satisfied is item #5: “My program advisor helps me work toward career goals.”? Even then the difference was relatively small (5.21 vs. 5.10 on a 7-point scale) and this was the item where we had the overall lowest level of student satisfaction.

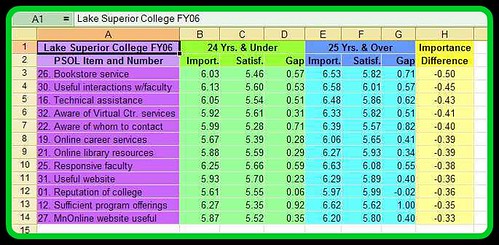
It was also interesting to note that they were not only universally less satisfied, but that they also ranked 35 of the 36 items as being less important than the older students did. Many of the differences in importance are rather large, such as shown in the embedded worksheet below. These 12 items had the largest difference in Importance score from the two student groupings. I couldn’t get the embedded spreadsheet to work here, so I inserted a screenshot below, or go here to open in a new window.

age_differences


Again, this really begs the question about how do we alter our services provided on the basis of this information? You let me know if you have any ideas and I’ll let you know if I ever come up with one of my own.