Category Archives: Peer Groups

PSOL Aggregations

For the PSOL, Noel-Levitz creates five categories from the 26 core items that have both a satisfaction and importance score. Those five categories are:

  1. Academic services (7)
  2. Enrollment services (4)
  3. Institutional perceptions (2)
  4. Instructional services (8)
  5. Student services (5)

In each of these categories, there are two or more questions (indicated in parentheses above) that are combined to create the aggregate score.

Column chart of PSOL results

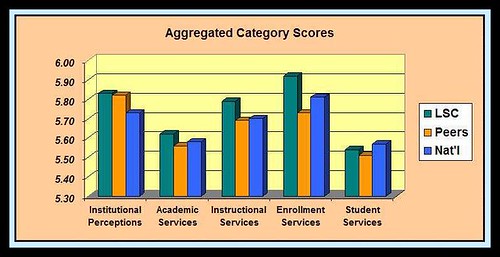
This column chart shows the LSC scores as compared to both the peer group of 13 similar two-year schools as well as the national results from more than 60 schools. Our best performance is in the Enrollment Services category and our largest opportunity for improvement is in the Student Services category.

To really make any improvements in these rankings you must look at the underlying specific survey items and attempt to improve services or otherwise improve the level of satisfaction expressed by the students. These are the five questions that comprise the Student Services category score:

  • 10. This institution responds quickly when I request information. (Our score here is good!)
  • 15. Channels are available for providing timely responses to student complaints.
  • 19. Online career services are available.
  • 22. I am aware of whom to contact for questions about programs and services.
  • 26. The bookstore provides timely service to students. (NOT considered to be Student Services on our campus.)

Age Differences

In the previous post I suggested that we needed to compare the demographics of the LSC PSOL students with the students in the peer group to see if there were any significant differences which might make the results not perfectly comparable. My conclusion was that there are several demographic factors where the groups differ, but in total they appear to just about even out without a huge bias either in favor of or fighting against one group or the other.

One of the factors of possible differences has to do with the larger percentage of younger online learners (46.2% vs. 34.2%) that we have at LSC. At the Noel-Levitz conference this summer I learned that their research has shown that the younger students generally show significantly lower satisfaction rates than the older students. It finally occurred to me that I do have the data to study for evidence of this phenomenon, at least for the LSC students.

The LSC data does show a huge difference between the two groups of learners. Those 24 years and younger are less satisfied than those 25 years and older on all but one of the 36 items ranked for both importance and satisfaction. The only item where younger students are more satisfied is item #5: “My program advisor helps me work toward career goals.”? Even then the difference was relatively small (5.21 vs. 5.10 on a 7-point scale) and this was the item where we had the overall lowest level of student satisfaction.

It was also interesting to note that they were not only universally less satisfied, but that they also ranked 35 of the 36 items as being less important than the older students did. Many of the differences in importance are rather large, such as shown in the embedded worksheet below. These 12 items had the largest difference in Importance score from the two student groupings. I couldn’t get the embedded spreadsheet to work here, so I inserted a screenshot below, or go here to open in a new window.

age_differences


Again, this really begs the question about how do we alter our services provided on the basis of this information? You let me know if you have any ideas and I’ll let you know if I ever come up with one of my own.

Peer Group Demographics

I posted recently about our 13-school peer comparison group for the 2006 PSOL and how this would be our best group for benchmarking since they are all two year schools. It is also necessary to look a little deeper to make sure that the respondents are similar so I compared the demographics of the two groups.

  • Ours were 81.6% female, theirs were 78.7% female. Females generally give more favorable satisfaction ratings on such surveys (unless they are being surveyed about their husbands).
  • Ours were 46.2% age 24 and under, theirs were 34.2% in that age range. Younger students tend to give lower satisfaction ratings than the older age groups.
  • 58.2% of ours indicated that they were primarily online students, compared to 59.7% of theirs. It has been my experience that those who identify themselves as mainly online tend to look more favorably upon their experience learning online than those who consider themselves to be primarily on-campus learners just taking an online course or two.
  • 61.2% of our students indicated that they are taking full-time class loads, compared to 47.1% of the peer group students. Part-time students tend to rate their satisfaction more highly than full-time students.
  • It was almost a draw for the percentage indicating that their educational goal was to complete an online degree program: 21.9% for us and 22.7% for them.
  • Even more of a draw for the percentage indicating that their educational goal was to complete an on-campus degree program: 34.7% for us and 35.0% for them.
  • For our students, 62.1% indicated that they had taken 0-3 previous online courses, while 75% of the peer group had that same level of previous experience. From a pure logic perspective (or maybe it is common sense), those with more experience with online courses tend to have higher satisfaction ratings, with the best measure of their satisfaction being their continued enrollment in more online courses.

Therefore, the question to be answered is whether our student group would tend to be more favorable than the peer student group. Here is my opinion:

  • Gender: slight bias in favor of high LSC satisfaction ratings, but not much.
  • Age: significant bias against high LSC satisfaction ratings.
  • Primarily online: no significant difference.
  • Part-time class loads: significant bias against high LSC satisfaction ratings.
  • Educational goal: no significant difference.
  • Previous online experience: significant bias in favor of high LSC satisfaction ratings.

The net result? I’d call it a draw, although really I think that there is a slight demographic bias against favorable satisfaction ratings for LSC compared to the peer group. The fact is that the LSC student satisfaction ratings were significantly higher than the peer group ratings. I’m arguing here that those are real differences, not caused by survey respondent biases. The first chart below shows how the LSC online students answered the questions about current plans/reasons for taking one or more online courses. The second chart is for the peer group of students.


Current Plans - LSC Students - http://zohosheet.com


Current Plans - Peer Group - http://zohosheet.com

PSOL Peer Group

On September 13, 2006, I received new data from Noel-Levitz regarding the PSOL (Priorities Survey for Online Learners) that we gave for the third year in a row during spring semester 2006. The data have always been useful but the report received today is the most useful for benchmarking that we have ever received.

Coming from a two-year public institution, our comparisons with the national results were interesting but not terribly useful for benchmarking purposes. Many of the schools included in the national results are very dissimilar from LSC. It includes graduate schools, for-profit schools, schools that are completely online (not blended as we are with both F2F and online), and overall just a hodge-podge of different schools that have used the survey during the past several years.

This spring we received better data because 16 of our sister institutions in MnOnline also gave the same survey at the same time. This was definitely better because it gave us comparison data with a group of schools from our own system. However, that still compares us with the state universities as well as some two-year schools who aren’t as experienced as we are at providing online learning and services. Also, no one really wants to talk about the consortium data because the aggregated student satisfaction levels are really quite low.

So, this new report from Noel-Levitz (that we paid for) compares the LSC results with a peer group of 13 two-year institutions from throughout the country. Approximately 3,900 student responses comprise the peer group and they come from a mixture of traditional community colleges as well as technical colleges, much like how LSC is a combined community and technical college.

On the 26 standard items on the PSOL, LSC students were more satisfied on 19 of the items and less satisfied on 7. Even more importantly, there were six of the 26 items where the difference in satisfaction levels were statistically significant. On all six of those items, the LSC score was much higher than the peer group score.

Below I’ll post a couple of charts that show some of the data comparing the LSC “Primarily Online” students with the similar group from the peer group institutions. The first chart shows the three most significant differences (.001 level) from that data set.

LSC vs. Peer Group - http://www.zohosheet.com

The second chart shows the two items that were significant at the .01 level, again coming from the “Primarily Online” segment of the data pool. FY06 Noel-Levitz PSOL: LSC vs. Peer Group - http://www.zohosheet.com 
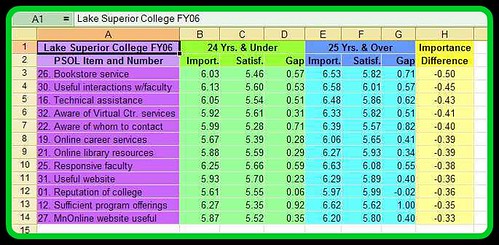
The third and final chart shows the four items that were significant at the .05 level. This data set of primarily online students had nine total differences that were significant, and all nine were positive differences for LSC.

FY06 Noel-Levitz PSOL: LSC vs. Peer Group - http://www.zohosheet.com

Charts made with ZohoSheet.

Technorati Tags: , , ,