Looking for Evidence of GenY Traits

You can count me among the skeptics of much of what is written about Generation Y, (or Millennials, or as I prefer to call them, the Digital Net-Gennials). I decided to take a look at our most recent PSOL data to see if we can see any evidence of any of the claims made.

One of the traits that is claimed by the “experts” about the Digital Net-Gens is that they are team-oriented. This is often promoted as meaning that they prefer to play in groups and work in groups. There is one statement on the PSOL that appears to get at this type of information.

#8: Student-to-student collaborations are valuable to me.

Of the 36 items on the PSOL that are ranked for both importance and satisfaction, this one always comes out as #36, at least in importance. It also has the distinction of usually getting a higher score for satisfaction than for importance. That is very odd for survey questions of this type. Roughly translated (IMO), they are saying some like this: “I really don’t care very much about this item, but you’re doing a pretty good job with it.”

PSOL data for student-to-student collaborations

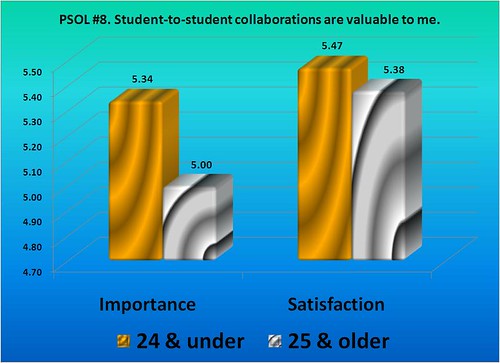
The chart above shows something that I would not have predicted. The students 24 years old and younger (roughly making up the Digital Net Gens) did in fact score the importance of this item as significantly higher than did those students who are 25 & over. NOTE: 296 students in the PSOL survey indicated their age as 24 and under while 283 students indicated age ranges of 25 and over, so the total population was almost evenly split.

The difference of .34 in importance (5.34 for the younger and 5.00 for the older) is clearly a significant difference in importance. So, even though the importance of group work (student collaborations) rates low overall for our online students, the Digital Net Gens do seem to value group work more than the older students. Go figure. I guess every once in a while some of this junk has to work out this way.

Or does it? If I make my own counterpoint to the previous point, there could easily be other factors at play here that are related to age differences, but not necessarily generational trait differences, if you follow my drift. In other words, although the younger students expressed a different level of importance for this item, it might not be because they have different generational traits (Digital Net Gens versus the Gen X-ers and Boomers), but just because older people have different life constraints.

Here’s what I’m getting at. Some other demographic differences between these groups besides the age difference include:

  • Primarily on-line student or primarily on-ground student?
    • 24 & under: 49% primarily on-line enrollments
    • 25 & older: 69% primarily on-line enrollments
  • Full-time work status, or part-time, or not employed?
    • 24 & under: 27% work full-time
    • 25 & older: 52% work full-time
  • Residence: Own home, renter, live with relatives, etc.?
    • 24 & under: 12% own home
    • 25 & older: 61% own home
  • Marital status: Married, single, or other?
    • 24 & under: 9% married
    • 25 & older: 54% married
  • Parental status?
    • 24 & under: 13% have kids
    • 25 & older: 60% have kids

So, let’s add that up. Twice as many of the older group work full-time, five times as many own a home (with all the responsibilities and time suckers that come with that), six times as many are married (with all the time suckers that are implied therein), and over four times as many have kids (you know the drill).

What a surprise that the older group isn’t as crazy about group work (defined currently as student-to-student collaborations) as the younger group. When exactly, do they have the time to fit this into their schedules? And how exactly does that make the generations different from one another?

A.A. Student Comparisons

For the 2009 PSOL survey I have been analyzing the results of our two largest groups who completed the survey; the students pursuing the Associate in Arts degree primarily online and those students pursuing the same degree primarily (but not completely) through on-ground courses.

Out of the 579 students who submitted the survey, 148 indicated that they are completing online A.A. degree while 131 indicated that they are completing the on-ground A.A. degree with an online course or two or three mixed into their schedules.

summary ratings on column chart

I’ve previously written about how I don’t find the summary questions to be completely useful, at least not the first one (what WERE their expectations?), but I do think that when you see a very large difference in the ratings that you do need to pay attention to the results. As shown in the slides above, the online A.A. students are clearly far more satisfied than the on-ground A.A. students.

As you can imagine, this is the type of data that almost no one on campus wants to hear about. The only way that this data could be generated is through suspect surveying methods or misleading questions. No way that students think online is better. NO WAY!!

PSOL Gap Analysis

Watch the gap signListed below are the 12 largest gaps out of the 36 items in the PSOL for Lake Superior College in spring 2009. The difference between importance and satisfaction as rated by the students is known as the gap, which represents the amount of improvement needed in your satisfaction score to bring it up to equal the importance score. Gap analysis is a way of concentrating your improvement efforts in the right areas to maximize value for students.

CC photo by Joe Shlabotnik

FY09 PSOL (Priorities Survey for Online Learners) LSC Students
Item – Gap: high to low Import. Satisf. Gap
20. The quality of online instruction is excellent. 6.56 5.68 0.88
12. There are sufficient offerings within my program of study. 6.44 5.58 0.86
09. Adequate financial aid is available. 6.46 5.66 0.80
06. Tuition paid is a worthwhile investment. 6.55 5.77 0.78
32. Layout of courses, as designed by instructors, is easy to navigate and understand. 6.60 5.83 0.77
11. Student assignments are clearly defined in the syllabus. 6.51 5.80 0.71
05. My program advisor helps me work toward career goals. 6.11 5.40 0.71
33. Instructions to students on how to meet the course learning objectives are adequate and clearly written. 6.58 5.90 0.68
07. Program requirements are clear and reasonable. 6.50 5.82 0.68
35. Instructional materials have sufficient depth in content to learn the subject. 6.54 5.91 0.63
30. Interactions I have with online instructors are useful to me in the learning process. 6.46 5.84 0.62
22. I am aware of whom to contact for questions about programs and services. 6.28 5.68 0.60

Many schools have gaps above 1.0, but we typically (in 5 years of surveying) have not had any gaps that large. Still, it is important for us to focus on a few areas each year for targeted improvement. In order to achieve an improvement in the survey scores over time, a couple of factors need to be present:

  • the item needs to be something that you have some control over or can influence where that control is held
  • the item needs to be controllable in the short-term (if you want to see reportable improvements in the next year or two)
  • the item needs to be something where the cost of achieving the improvement is less than the benefits to be received, if possible

For example, item #9 is the statement that “Adequate financial aid is available.” Although we might be able to add another scholarship or two to those already offered, we really don’t have much ability to make a difference in the amount of financial aid available to students. So, although it’s nice to know what they think about the availability of financial aid, there’s little we can do about it. That is not a gap that we (as an institution) can do much about. However, the Feds and the State of Minnesota sure could make a difference there if they wanted to help educate the populace.

On the other hand, there are five items in this top 12 list which could be targeted for improvement with a major campaign to help faculty improve these items in their courses:

  • #11 – Student assignments are clearly defined in the syllabus.
  • #30 – Interactions I have with online instructors are useful to me in the learning process.
  • #32 – Layout of courses, as designed by instructors, is easy to navigate and understand.
  • #33 – Instructions to students about how to meet the course learning objectives are adequate and clearly written.
  • #35 – Instructional materials have sufficient depth in content to learn the subject.

Our online faculty peer review process absolutely makes a difference in items 32, 33, and 35 shown above. In fact, I shudder to think how large the gap might be if we didn’t have that process in place and if we hadn’t made good progress over the past several years. Still, not all faculty participate in the voluntary process, and not all courses have been reviewed. Therefore, we have the opportunity to encourage all online faculty to consider spending some time to beef up these areas, and of course we can provide some professional development opportunities to help them do so. By doing so, we should also help make a difference in the largest gap on the list, item #20.

Added Questions – Mission Accomplished

For the Noel-Levitz PSOL, there are spaces for 10 customized questions in addition to the 26 standard questions (statements, actually) where students indicate both their levels of importance and satisfaction. Since we give the survey in conjunction with many other MnSCU schools we all use five common statements that get at some of the data that they need to collect for the MnOnline system as a whole. That leaves five more survey slots for each college or university to ask whatever they want.

This year I made an effort to find five statements that the students would rank with high importance scores. I don’t fall into the camp that says that you need to keep asking the same questions each year for the sake of continuity. If a statement didn’t pan out with a high enough importance score in previous years, I want to try a new one in hopes of hitting those things that are most important to students.

I sent out a call to other MnSCU schools to try to find out which statements they had used in previous years that had the highest importance scores for students. I set up a wiki for people at other schools to share information about the added statements that they have used in previous years. Some good information was gathered through the wiki, but at the last second I had a bit of an epiphany – yet one that I wasn’t sure would bear fruit.

For five years now we’ve had an online course design peer review process, modeled after Quality Matters of MarylandOnline. It occurred to me that there would probably be some items in the course review rubric (sample completed rubric PDF) that would make worthy survey statements. BINGO! I picked five statements from different sections of the rubric and added them to the PSOL, statements 32-36. I was very pleased to see these five items come back with very high importance scores. In fact, the five LSC added items were all ranked in the top 10 (out of 36) for importance. Our five added statements are highlighted in red below.

FY09 Noel-Levitz PSOL (Priorities Survey for Online Learners) LSC Students
Item – Importance high to low (top 10 items only)
Import. Satisf. Gap
32. Layout of courses, as designed by instructors, is easy to navigate and understand. 6.60 5.83 0.77
33. Instructions to students on how to meet the course learning objectives are adequate and clearly written. 6.58 5.90 0.68
20. The quality of online instruction is excellent. 6.56 5.68 0.88
28. The online course delivery platform (Desire2Learn or D2L) is reliable. 6.56 6.04 0.52
34. Grading policies are easy to locate and understand in courses. 6.56 6.09 0.47
06. Tuition paid is a worthwhile investment. 6.55 5.77 0.78
18. Registration for online courses is convenient. 6.55 6.36 0.19
36. Clear standards are set in courses for instructor availability and response time. 6.55 5.99 0.56
31. Taking an online course allowed me to stay on track with my educational goals. 6.54 6.18 0.36
35. Instructional materials have sufficient depth in content to learn the subject. 6.54 5.91 0.63

In addition to the five highlighted in red above, statements #28 and #31 are part of the 5 added statements for MnOnline. Therefore, only 3 of the top 10 items come from the 26 standard statements on the basic PSOL.

This seems particularly reaffirming to me. One – it indicates that many of the items identified on the course design quality rubric are not just important to teachers, but they’re important to students as well (that’s not always the case). Two – because the satisfaction scores on those items are also pretty decent (all in the top 50% for satisfaction ranking), it also appears that our peer review process is making a difference that is recognized by students. Three – it’s always nice when you find out that what you thought should be important actually is important. Overall, I think all of us can be very proud of these survey results.

For the record, the five highlighted statements shown above correlate to the following standards on the LSC course design rubric:  I.2, II.2, III.2, IV.1, and V.3.

Survey Incentives for Everyone

This year for the Noel-Levitz PSOL I tried a different approach with survey incentives. Every student who completed the student satisfaction survey received a 2GB flash drive for their trouble. Since this is the fifth time we have used the survey, I have some pretty good baselines to compare results with, and partly I was interested in what a difference the more liberal incentives policy would make. Last year we gave out 40 flash drives in a random drawing and saw an increase in submissions from prior years. This year we went another step down that road.

PSOL response rates chart

We received 121 more responses than the previous high number of returns from 2008. The percentage response rate only went up from 23% to 25%, which is a pretty modest increase. However, that increase of only 2 percentage points resulted in an increase of 24% more responses (121 more with a 2008 base of 458 responses) since our online student population was also a couple hundred students higher in 2009 than in 2008.

Basically, we spent about $3,000 in incentives in order to get significantly more information. You’ll see in the upcoming posts that the satisfaction data collected this year is very similar to the data in all the other years. One thing I was interested in seeing is whether the added incentives might change the results – would more students answer the survey without really putting out the effort to answer sincerely, for example? Apparently not (at least in my opinion).

Online Learners – What’s Important?

This will be cross-posted at my e-Learning blog. I have been analyzing some of the data (again) from the 2008 PSOL survey. This is the fourth year that we have used this Noel-Levitz survey at Lake Superior College. The embedded slides explain a bit more about the survey, including the four sets of data that are compared for online student ratings of both importance and satisfaction.

[slideshare id=834231&doc=2008psoldatacharts-1228861953635614-9&w=425]

(NOTE: visit SlideShare to use the full screen option.)

There are 26 items that are included in all PSOL submissions. You can add other items but only the first 26 can be compared across other populations since these are the only items answered by all students. In order of descending importance, here are the top eleven items for LSC students on the 2008 PSOL (survey item number is indicated at beginning of each line).

1. (20) The quality of online instruction is excellent.
2. (25) Faculty are responsive to student needs.
3. (11) Student assignments are clearly defined in the syllabus.
4. (18) Registration for online courses is convenient.
5. (07) Program requirements are clear and reasonable.
6. (06) Tuition paid is a worthwhile investment.
7. (12) There are sufficient offerings within my program of study.
8. (23) Billing and payment procedures are convenient for me.
9. (04) Faculty provide timely feedback about student progress.
10. (03) Instructional materials are appropriate for program content.
11. (10) This institution responds quickly when I request information.

There are clearly other items that are very important to online learners but are not included in the 26 PSOL items. Please leave a comment if you have some ideas about what they might be. Thanks.

Student Satisfaction: Online vs. On-ground

These slides show the comparisons between our 2008 PSOL results and the 2008 SSI (student Satisfaction Inventory) results. There are eleven questions that match up between the two surveys, including some that we added for that very purpose.

[slideshare id=591501&doc=psolssi2008charts-1221054827135496-8&w=425]

To clarify: here are the questions that were compared from the two groups.

PSOL # SSI # Item
01 45 This institution has a good reputation.
04 46 Faculty provide timely feedback about student progress.
07 66 Program requirements are clear and reasonable.
09 07 Adequate financial aid is available.
20 18 The quality of (online) instruction is excellent.
21 14 (Online) Library resources and services are adequate.
23 52 Billing and payment procedures are convenient for me.
24 50 Tutoring services are readily available (for online courses).
32 23 Faculty are understanding of students’ unique life circumstances.
34 32 My academic advisor is knowledgeable about my program requirements.
36 75 The LSC Help Desk responds with useful information and solutions.

Average Satisfaction Scores

The basic PSOL has used the same 26 questions during all four of the survey administrations that we have conducted here at LSC. I decided to make a few simple calculations that are not normally made by Noel-Levitz.

One thing that they do with the data is aggregate them into five separate categories, such as Enrollment Services, Academic Services, etc. It seemed to me that you could also get an overall feel for student satisfaction by calculating the average satisfaction score of all 26 items. This simple average seems somewhat relevant to me as a measure of overall student satisfaction, and is probably more relevant than a couple of the PSOL overall satisfaction survey questions – such as whether their expectations have been met, exceeded, or not.

PSOL chart of average student ratings for four years
The chart above (click to enlarge) indicates the average scores over the four survey periods for students of LSC Online. I think it’s instructive to see that the average satisfaction score has increased each time on a year-over-year comparison. I realize that there is still an issue about whether the rights things (most important ones) are increasing in satisfaction rating, but I do think that this is still something worth paying attention to.

Desire2Learn Scores High in Reliability

This is cross-posted from my e-learning blog: Desire2Blog

The chart below shows the results over the past three years to the following statement:

The online course delivery platform (Desire2Learn or D2L) is reliable. (click photo to enlarge)

D2L reliability chart from PSOL

The PSOL is the main instrument that we use to gather information from students about the online programs and services that we provide. In two of the last three years, reliability of the VLE platform (we all use Desire2Learn) has been rated as the most important factor out of the 30 (31 this year) questions asked of all students. The satisfaction rating (6.01 in 2008), is also one of the highest scoring. This year it comes in with the 2nd highest satisfaction rating out of 31 statements, with first place going to “Registration for online courses is convenient.” (rating of 6.21)

I realize that the reliability factor does not capture all of the pertinent information about a VLE, but clearly it is an important one. Credit for the high student ratings goes both to Desire2Learn for the product development as well as to the MnSCU Office of the Chancellor staff who actually host and troubleshoot the service for our several hundred thousand user account holders.

Congratulations are in order for these high marks related to student satisfaction.

NOTE: the survey uses a 7 point scale where 6.0 is satisfied, 7.0 is very satisfied, 5.0 is somewhat satisfied, and 4.0 is neutral. The other 29 items rated below the D2L item ranged in satisfaction scores from 5.96 to 5.12.